Most popular Halloween candy by state: why maps mislead
A new round of state-by-state Halloween candy maps started making the rounds this month, and a few of the headlines sound like they're arguing with each other. Montana's favorite candy is HI-CHEW, one map claims. Rhode Island loves Sour Patch Kids, says another. Search for the most popular Halloween candy by state and both claims turn up right next to a much bigger fact: Reese's Peanut Butter Cups outsold everything else in 40 states last Halloween, and chocolate filled the entire national top six (Instacart, published last month).
Those two things aren't actually in conflict. They're answers to different questions. "Most popular" measures what sells the most. "Standout" measures what sells unusually well compared to the rest of the country, and a map can say Montana "stands out" for HI-CHEW without that meaning HI-CHEW was Montana's top-selling candy at all (Visual Capitalist, published this week).
Both maps come from delivery and grocery platforms, Instacart and DoorDash, analyzing October 2025 transactions and publishing results months later, in 2026. Neither is a government survey or a census of every candy bowl in the country. They're a window into what shoppers on two specific apps bought, useful, but narrower than the headlines suggest.
The national baseline: what sells the most
Video of the Day
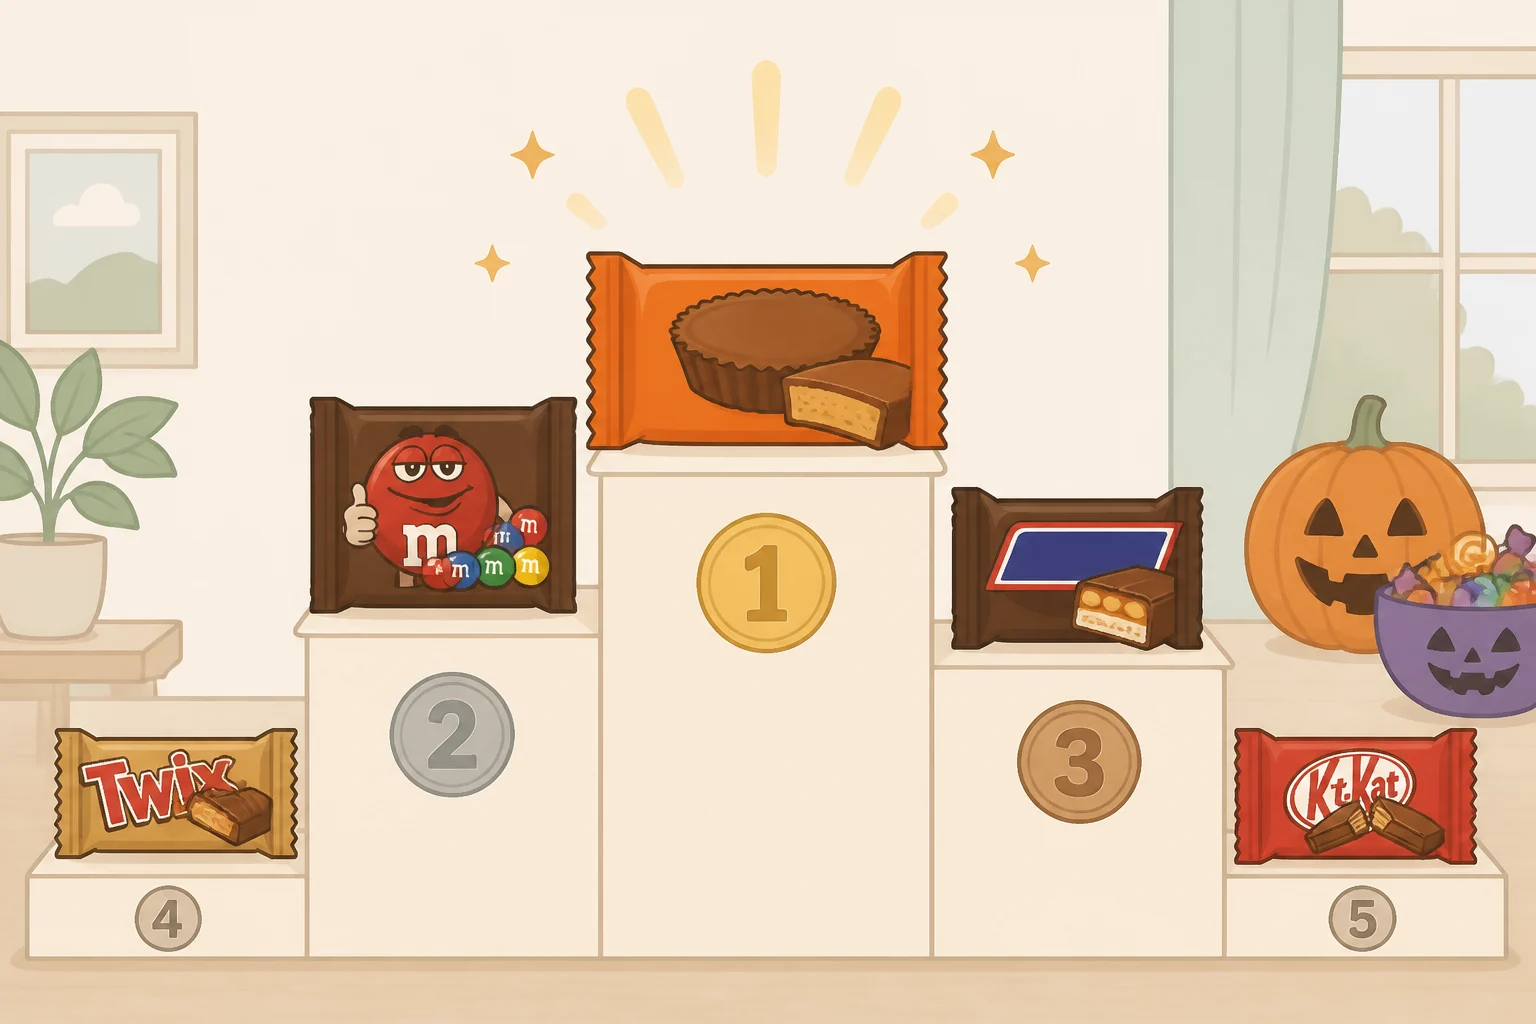
Start with the plain numbers, since everything else here depends on them. Reese's Peanut Butter Cups ranked No. 1 by ounces sold on Instacart in October 2025, and the next four spots were all chocolate too: Peanut M&M's, Hershey's Milk Chocolate, regular M&M's, and Snickers (Instacart, published last month). Sour Patch Kids was the first non-chocolate candy to crack the list, and it didn't show up until No. 7.
A separate DoorDash dataset points in the same broad direction. Its order data shows Reese's has held the national No. 1 spot for three years running, with chocolate claiming four of the top five positions (DoorDash, published in September). Two platforms, two different ways of counting, and the same basic picture: chocolate wins, and Reese's wins biggest.
There's one real exception worth naming now, because it comes up again later. Rhode Island was the only state where Sour Patch Kids outsold both Reese's and Peanut M&M's outright, the actual top seller by ounces (Instacart, published last month). That's a genuine break from the national pattern. Everything else in this article is a different kind of signal.
Video of the Day
Most popular Halloween candy by state vs. a Halloween candy map by state
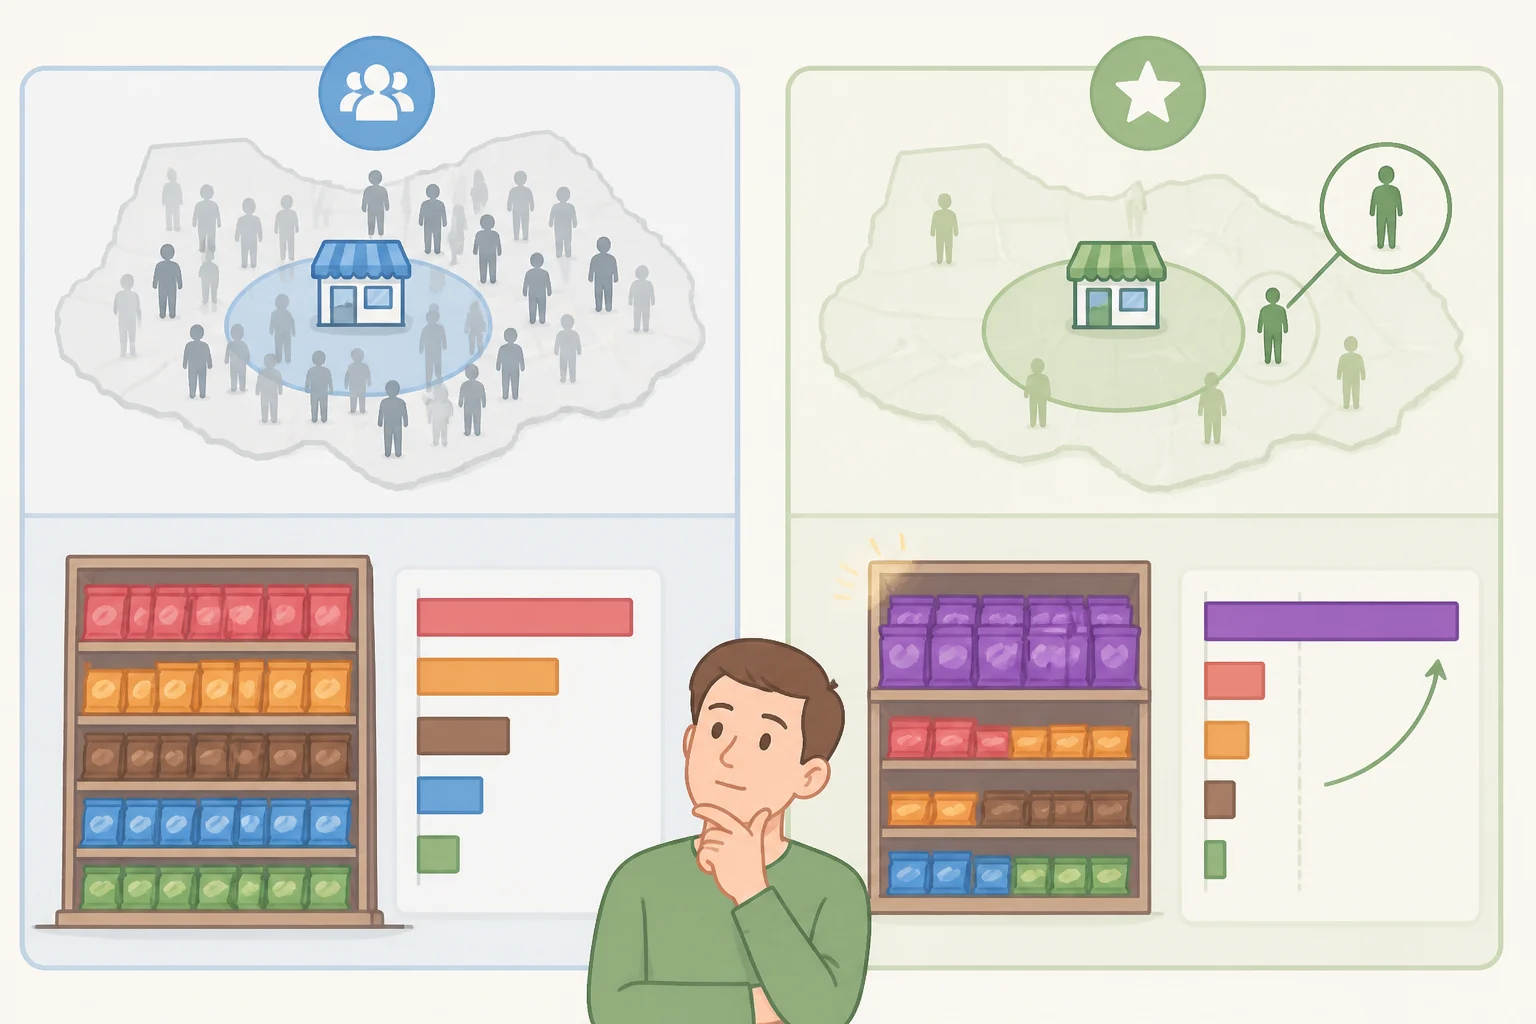
The distinction is in the denominator. Instacart's "standout candy" map doesn't rank each state's top seller. It flags candies purchased at a rate unusually high relative to that candy's share of sales nationwide, a measure of local over-indexing, not of volume (Visual Capitalist, published this week).
The headline number shows how dramatic that math can look. Montana's share of HI-CHEW purchases ran 616% above the national average, the single largest over-index Instacart found anywhere in the country (Visual Capitalist, published this week). Read quickly, that sounds like HI-CHEW must be Montana's favorite candy. It isn't, at least not by this data: the figure means HI-CHEW's share of Montana's candy purchases was more than seven times its national share, not that Montanans bought seven times as much candy overall, and not that HI-CHEW outsold Reese's there.
The scale of these over-indexes varies a lot once you look past Montana. Louisiana's Tootsie Pops over-index was 141%, and Rhode Island's Sour Patch Kids over-index, measured this way, was 109% (Visual Capitalist, published this week). Both are real local patterns. Neither comes close to Montana's number, which is why Montana made headlines and Louisiana didn't.
DoorDash runs a similar comparison on different material: its map highlights candies that each state ordered unusually often relative to the rest of the country, but it measures order volume on a delivery platform rather than ounces sold through grocery fulfillment, and its retail partners include assortment brands like Dollar General's Sweet Smiles that grocery data wouldn't necessarily surface the same way (DoorDash, published in September). When Sweet Smiles shows up as a Southern standout, that reflects an over-index on DoorDash's platform, which may owe as much to availability and assortment as to any underlying regional taste.
Both maps describe shoppers on two specific apps during one month. They reflect what's available through those retailers and that one delivery service, not a definitive record of what every household in a state hands out. That limitation matters before treating either map as "the" answer for any state's favorite Halloween candy.
Where the regional clusters actually show up
Once "standout" means distinctiveness rather than popularity, the state-by-state Halloween candy preferences in these maps read less like contradictions and more like texture sitting on top of a chocolate-dominated market.
What Instacart's map captures
Instacart's clearest geographic pattern runs through the Pacific Northwest. HI-CHEW over-indexes in Montana, Oregon, Washington, and Alaska, suggesting a genuine regional pocket rather than one outlier state (Visual Capitalist, published this week). Sour Patch Kids stands out across several Northeastern states. Skittles over-indexes through Texas, Oklahoma, Arkansas, and Georgia. Colorado and Wyoming share a candy-corn over-index, and California stands out for HARIBO Goldbears.
What DoorDash's map captures
DoorDash's separately collected order data turns up its own regional pockets, and they don't always line up with Instacart's. Sweet Smiles over-indexes across seven Southern states, including Georgia, Louisiana, and Tennessee. Laffy Taffy leads five Midwestern states, including Iowa and Wisconsin, and Airheads wins Florida and Texas. SweeTarts holds a sour corner of the Southwest across four states, including Idaho and Oklahoma (DoorDash, published in September).
A handful of other states pair off on the same pick, and a few stand entirely alone:
| States | DoorDash standout candy |
|---|---|
| Arizona, California | Red Vines |
| Missouri, Wyoming | Twizzlers |
| New York, Rhode Island | Kinder Bueno |
| Alaska, Hawaii | Lindt |
| Maryland, Nevada | Snickers |
| Connecticut, Illinois | Sour Patch Kids |
| Colorado (solo) | Haribo |
| North Carolina (solo) | Hershey's Bar |
| Minnesota (solo) | Mike and Ike |
Source: DoorDash, published in September.
Where the platforms agree or diverge
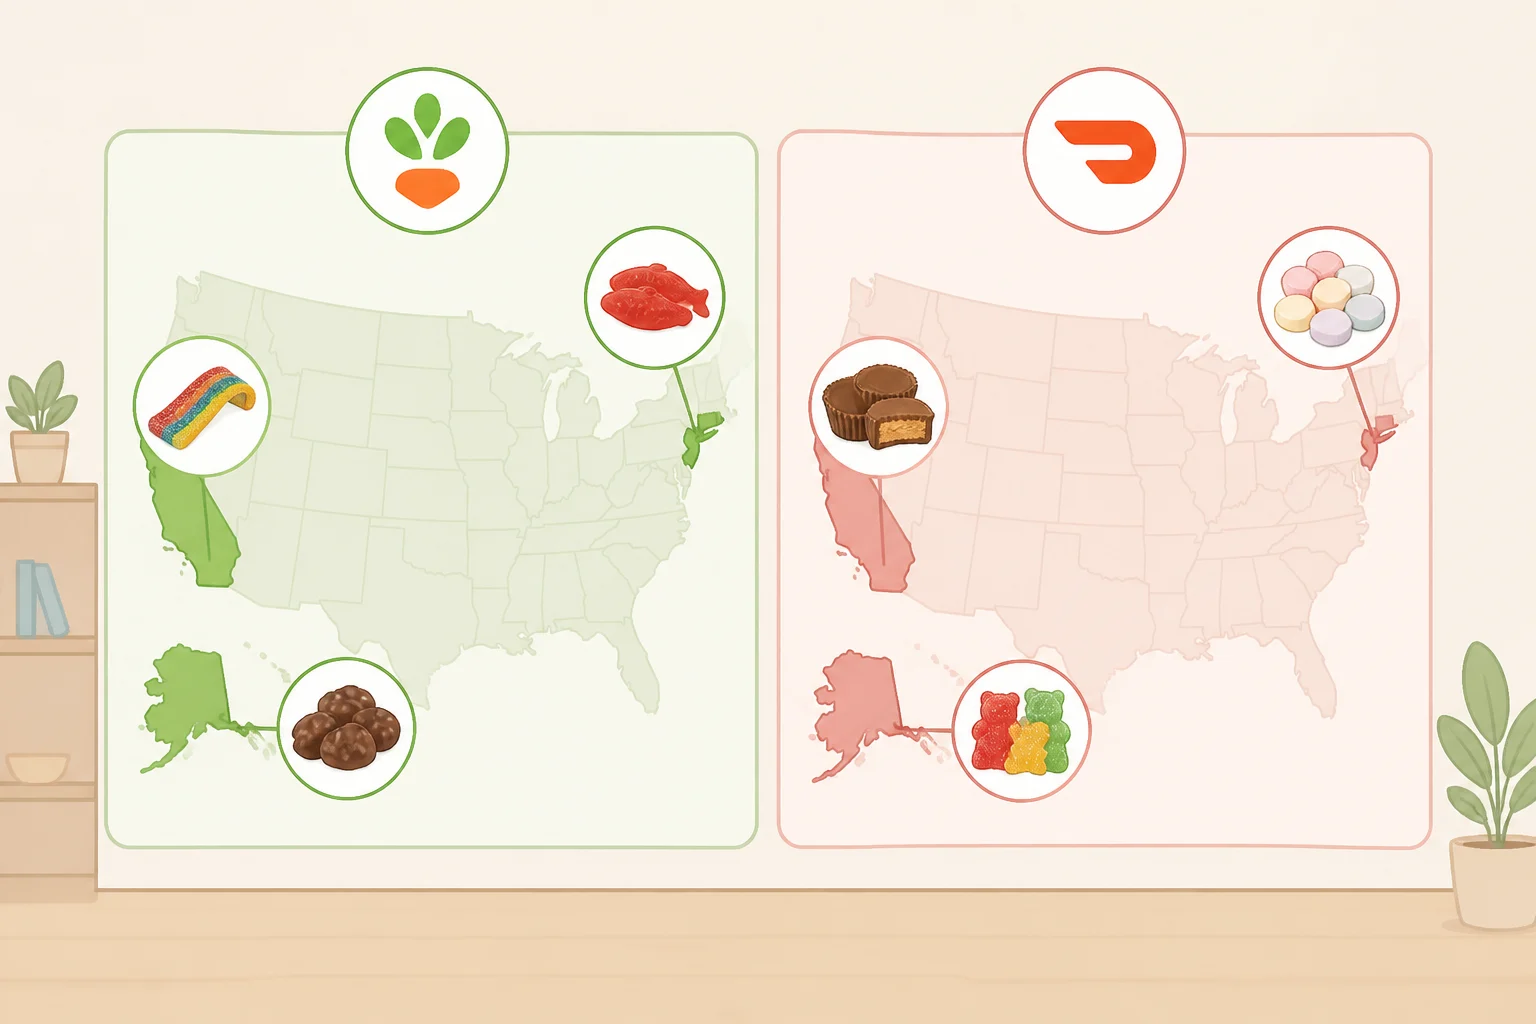
Put the two maps side by side and the disagreements become useful instead of confusing. Instacart ties Alaska to HI-CHEW; DoorDash ties it to Lindt. Instacart names California for HARIBO; DoorDash names it for Red Vines. Rhode Island splits too: Instacart's ounces-sold data shows Sour Patch Kids as the outright winner there, while DoorDash's order data flags Kinder Bueno as the state's over-indexed pick (DoorDash, published in September; Instacart, published last month). None of these are factual errors. The platforms measure different transaction streams, grocery ounces against delivery orders, using different units entirely, so their maps were never going to line up state for state.
A third Instacart measure captures something different again: overall buying intensity rather than which specific candy a state favors. Utah's total candy purchasing ran 67% above the national average, the highest in the country, followed by Idaho at 50% and Alaska at 47%, with Washington and Montana close behind at 43% and 40% (Instacart, published last month). Delaware, Pennsylvania, and New York bought the least relative to baseline, down 18%, 16%, and 15% respectively. Several Pacific Northwest cities, Anchorage, Eugene, Tacoma, Vancouver, and Spokane, appear among Instacart's highest-buying cities in the country.
Taken together, this is the genuinely useful part of a Halloween candy map by state: not a single authoritative favorite for each place, but overlapping, platform-specific pockets of chewy, sour, and value-brand activity sitting on top of near-universal chocolate demand.
Market context: chocolate prices and the candy aisle shift
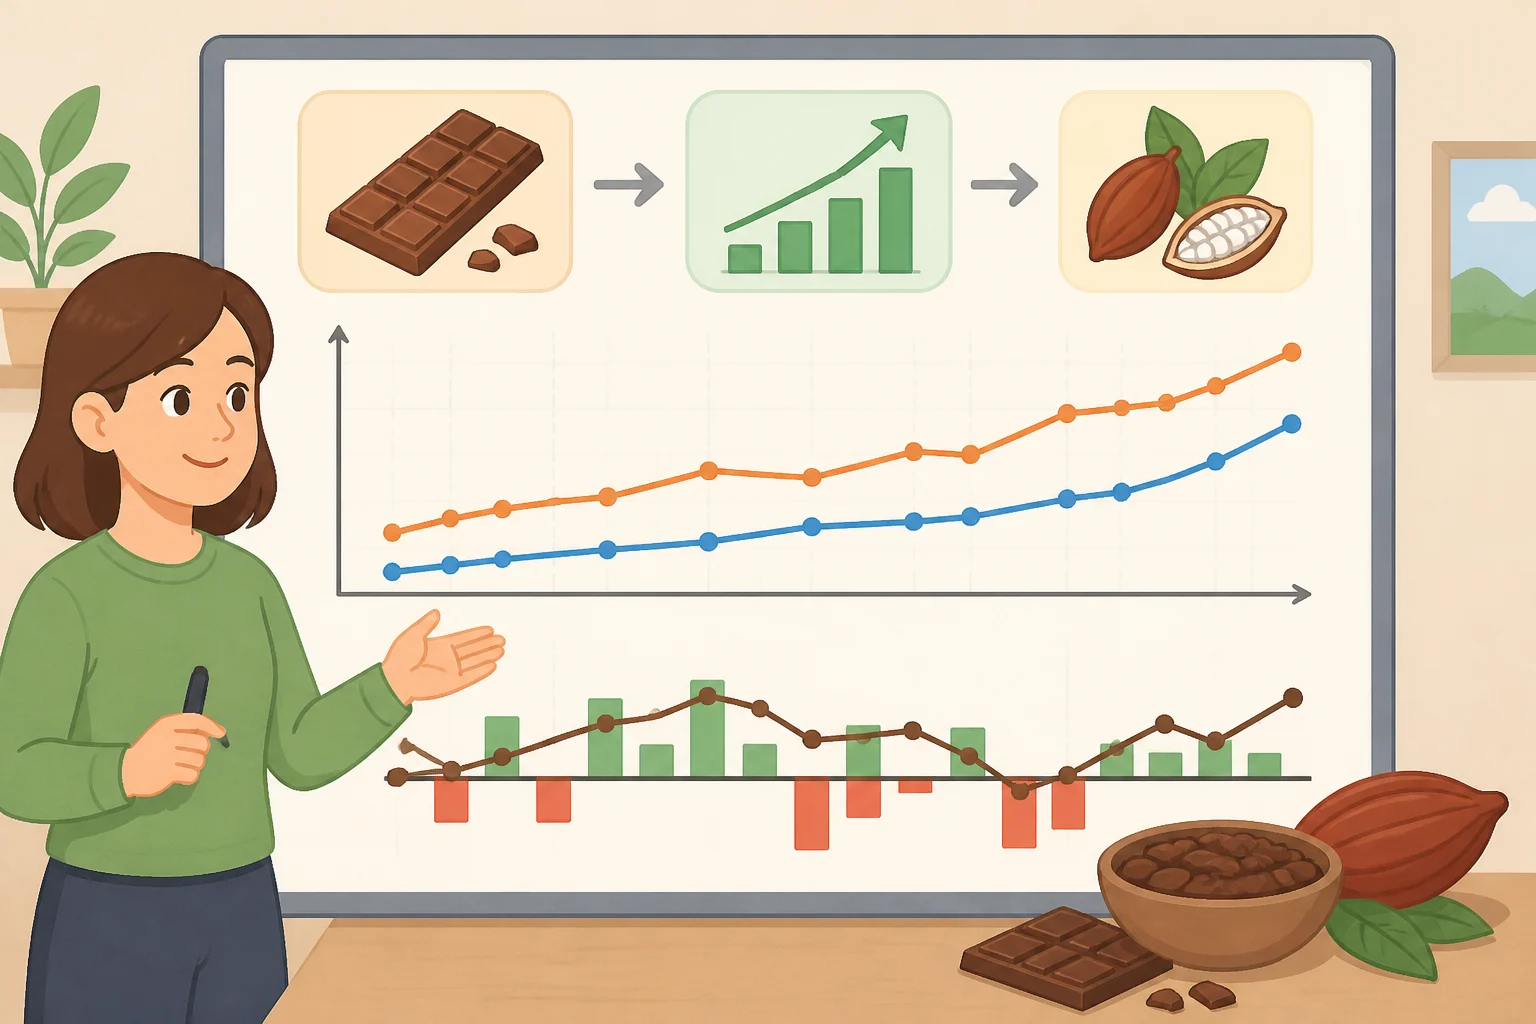
Price data adds context here, not an explanation, and it's worth keeping the two separate.
Chocolate retail prices climbed nearly 30% year over year and almost 78% over five years heading into last Halloween, driven by a global cocoa shortage after drought and crop disease hit West African harvests (CNBC, reported in October 2025). Cocoa futures tell a related but distinct story: they peaked above $12,000 per ton in late 2024 and had cooled to around $6,000 per ton by last fall, still more than double the pre-pandemic average (CNBC, reported in October 2025). Futures and shelf prices don't move in lockstep. Candy companies typically plan seasonal lineups well before the holiday, which can delay how quickly swings in commodity costs actually show up on store shelves.
The category-level effect was measurable. Chocolate's share of Halloween candy sales fell from 52% to 44% year over year as some shoppers shifted toward cheaper, trendier sweets (CNBC, reported in October 2025). DoorDash's order data shows a similar pivot at the product level: Airheads climbed from 10th to 7th nationally, and HARIBO cracked the top 10 for the first time, passing Nerds in total orders within three months (DoorDash, published in September).
The standout map and the price data both describe the 2025 Halloween season, but that overlap doesn't establish causation. Nothing in the research shows that high cocoa costs pushed Montana toward HI-CHEW or Rhode Island toward Sour Patch Kids. Those are distinct, product-specific patterns that existed alongside the price story, not proven effects of it.
What the map really tells you
Reese's and chocolate remain dominant by any standard measure: the top seller by ounces in 40 states on Instacart, the national order leader on DoorDash for three years running. Neither fact changes because a standout map highlights HI-CHEW in Montana or Sour Patch Kids in Rhode Island. What a map like that actually does is narrower and more useful: it flags which products are unusually strong in a given market relative to their national baseline, not which candy most households there actually hand out. Treating a 616% over-index as proof of a state's favorite is a common way these maps get misread, especially when the number itself is the most eye-catching part of the story.
Cocoa futures have cooled from their late-2024 peak but remain well above pre-pandemic levels, and chocolate's dented share of the 2025 Halloween season is worth watching again this year. Whether that pressure eventually reshapes any specific state's standout pick is a question the 2025 data doesn't answer. For now, the map says more about how a handful of products cluster regionally than about what's actually landing in trick-or-treat buckets from Missoula to Providence.