Home Sweet Home
Hacks, Tips & Tricks
Squeaky Clean
DIY Decor
Carpentry & Remodeling
Maintenance & Repair
Green Thumb
All Home Sweet Home
Chow Down
Main Dishes
Sweet Treats
Snacks
Copycat Recipes
Drinks & Cocktails
Sides & Appetizers
Veggie Faves
Food Hacks
All Chow Down
Get Crafty
Sew Simple
Fun Crafts
Art Projects
All Get Crafty
Let’s Celebrate
Valentine's Day
St. Patrick's Day
Easter
Mother's Day
Father's Day
4th of July
Back to School
Halloween
Thanksgiving
Christmas
New Year
Weddings
Baby Showers
Birthdays
Parties & Events
Gifts
All Let’s Celebrate
JOIN OUR NEWSLETTER
JOIN OUR NEWSLETTER
Home
Get Crafty
Fun Crafts
Fun Crafts
By
Kirsten Nunez
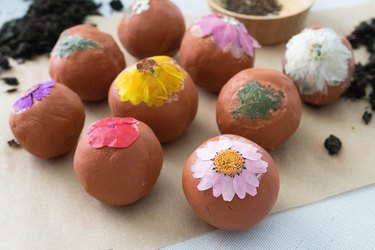
Cute Dried Flower Seed Bombs DIY
Get Crafty
By
Kalia Silva-Phillips
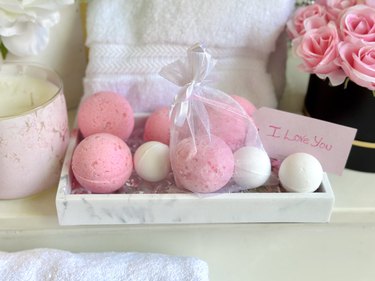
Mom's the Bomb! DIY Bath Bombs
Get Crafty
By
Elba Valverde
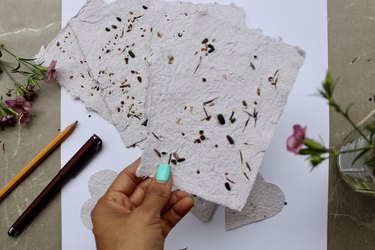
How to Make Seed Paper
Get Crafty
By
Kirsten Nunez
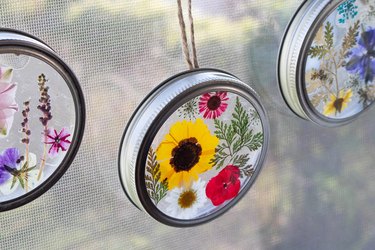
Upcycled Flower Suncatchers
Get Crafty
By
Kalia Silva-Phillips
DIY Shrinky Dinks Craft
Get Crafty
By
Beth Huntington
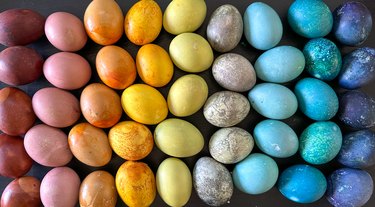
How to Dye Easter Eggs With Natural Egg Dyes
Get Crafty
By
Beth Huntington
Pi Day Bracelets
Get Crafty
By
Kalia Silva-Phillips
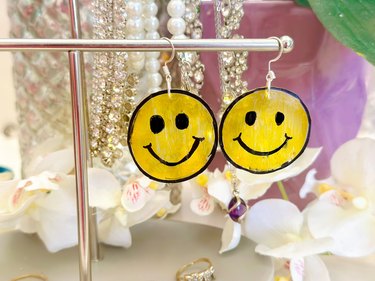
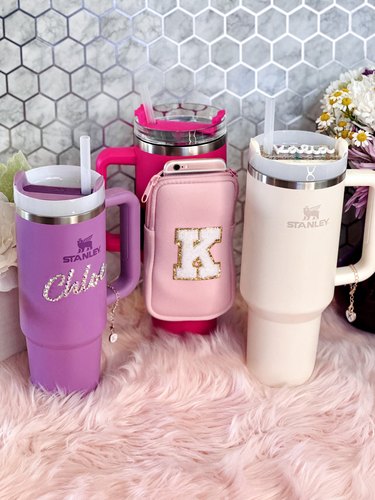
Stanley Cup Glow-Up
Get Crafty
By
Kirsten Nunez
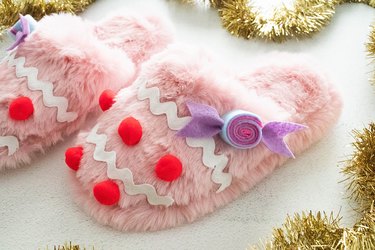
Candy Land/Gingerbread Holiday Slippers
Get Crafty
By
Beth Huntington
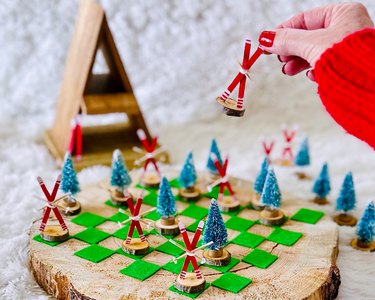
Ski Chalet Checkerboard
Get Crafty
By
Kathryn Walsh
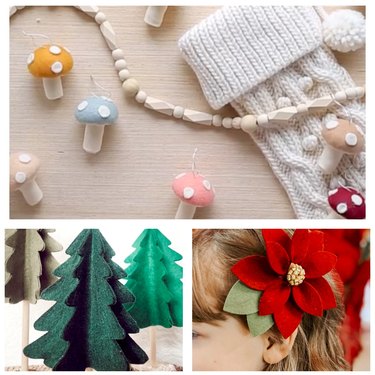
A Very Felt Christmas
Get Crafty
By
Kirsten Nunez
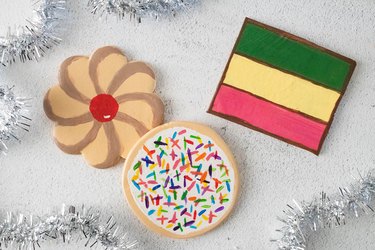
Italian Holiday Cookie Coasters
Get Crafty
By
Kirsten Nunez
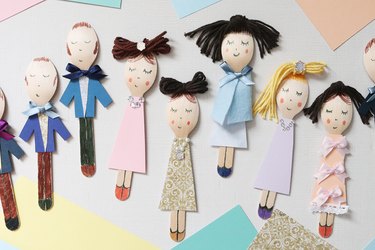
"Bridgerton"-Inspired Dolls Made From Wooden Spoons (Yes, Spoons!)
Get Crafty
By
Kalia Silva-Phillips
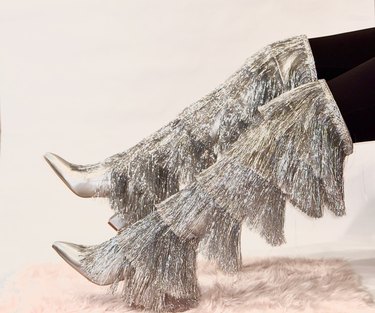
Beyoncé-Inspired Boots With Shimmery Silver Fringe
Get Crafty
By
Aleesha Nash
Printable Paper Dolls & Outfits to Inspire Your Imagination
Get Crafty
By
Kirsten Nunez
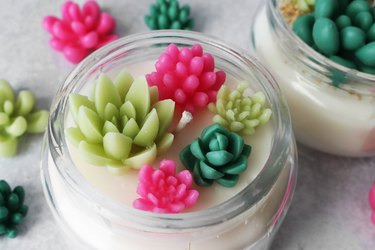
Succulent Terrarium Candles for Greenery & Glow
Get Crafty
By
Elba Valverde
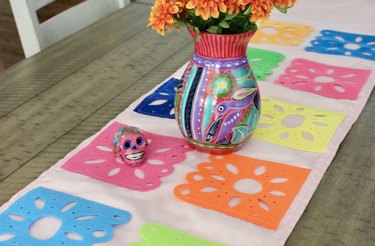
A Vibrant & Versatile Día de los Muertos Table Runner
Get Crafty
By
Beth Huntington
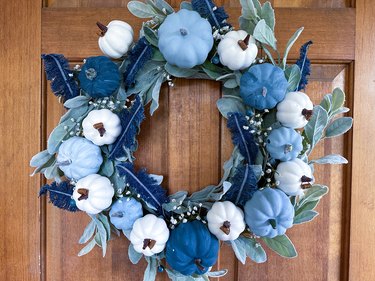
A Blue Pumpkin Wreath With Feathers Made From Old Jeans
Get Crafty
By
Elba Valverde
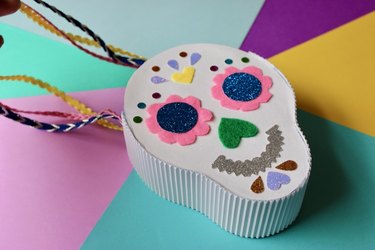
Sugar Skull Mini Bags for Día de los Muertos
Get Crafty
By
Kathryn Walsh
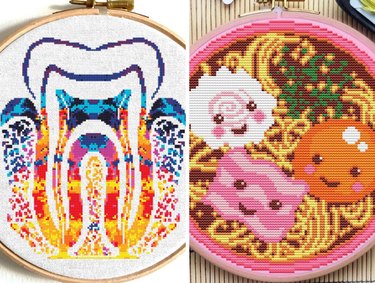
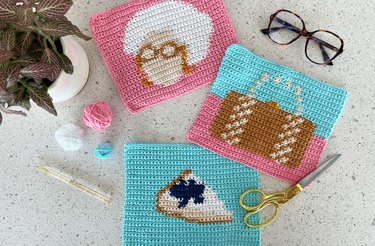
Quirky Cross-Stitch Patterns for the Unconventional Crafter
Get Crafty
By
Kathryn Walsh
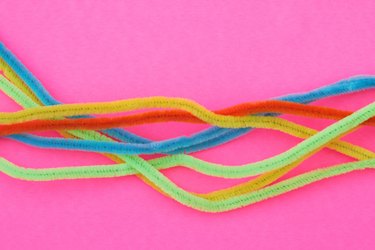
Pipe Cleaner Craft Ideas for Creative Kids & Adults
Get Crafty
By
Sophie Boudreau
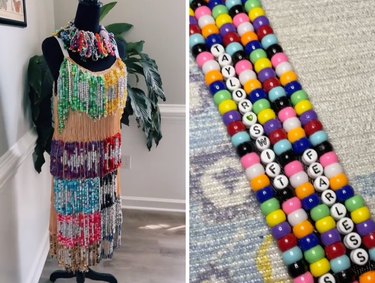
Even More Taylor Swift Friendship Bracelet Inspo (Dresses, Earrings & Beyond!)
Get Crafty
By
Beth Huntington
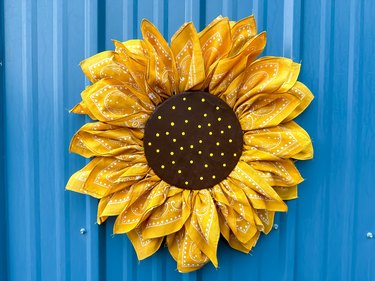
A Sunflower Bandana Wreath to Brightly Adorn Your Door
Get Crafty
By
Kathryn Walsh
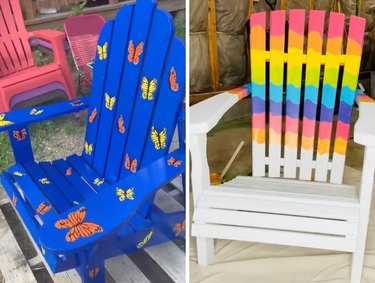
Adirondack Chair Makeover Ideas to Spruce Up Your Outdoor Seating
Get Crafty
By
Kirsten Nunez
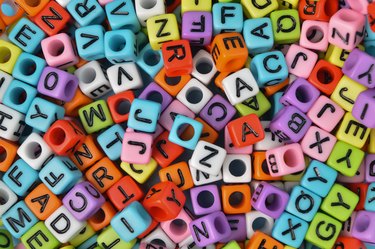
Nostalgic Friendship Bracelets to Share With Your Besties
Get Crafty
By
Beth Huntington
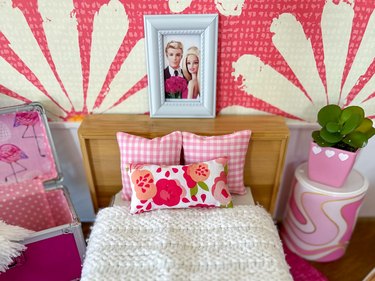
Dream Up Your Own Barbie House with a Cardboard Box
Get Crafty
By
Sophie Boudreau
Taylor Swift Friendship Bracelet Ideas from Social Media Swifties
Get Crafty
By
Kirsten Nunez
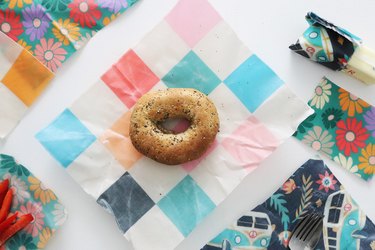
Homemade Beeswax Wraps to Keep Your Food Fresh
Get Crafty
By
Beth Huntington
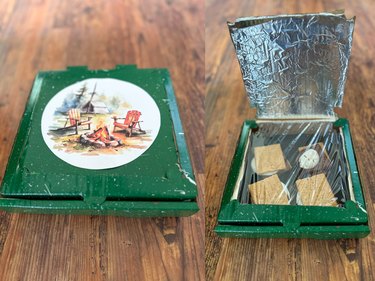
A Homemade Solar Oven With Vintage Camping Vibes
Get Crafty
By
Kirsten Nunez
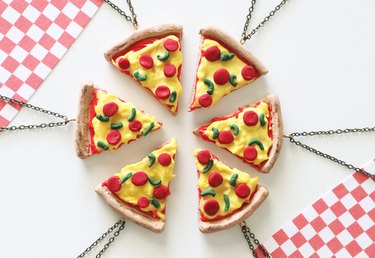
A-dough-rable Pizza Friendship Necklaces for Your BFFs
Get Crafty
By
Kirsten Nunez
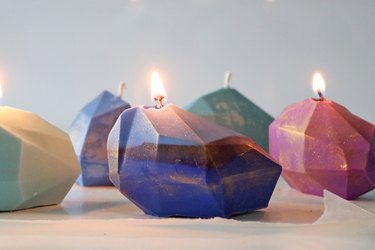
Get Your Glimmer on With Homemade Gemstone Candles
Get Crafty
By
Kirsten Nunez
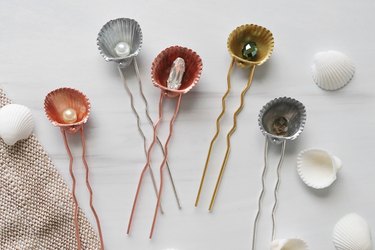
Seashell Hair Pins Pretty Enough for a Mermaid
Get Crafty
By
Kathryn Walsh
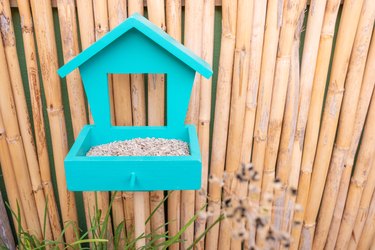
Brilliant Bird Feeders to Impress Your Feathered Friends
Get Crafty
By
Jenni Alexander
Picture It: A Trio of "Golden Girls"–Inspired Trivets
Get Crafty
By
Beth Huntington
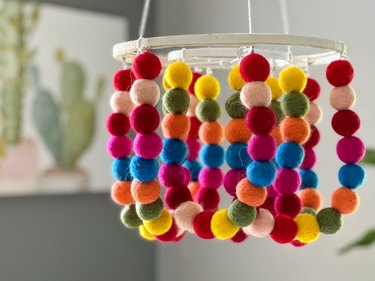
A Rainbow Pom Pom Chandelier to Brighten Any Room
Get Crafty
By
Beth Huntington
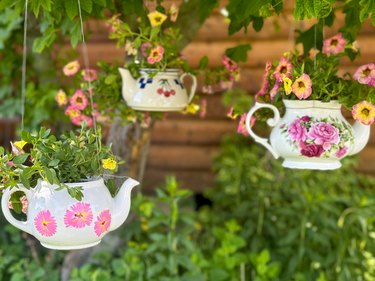
Playful Teapot Planters to Spruce Up Your Garden
Get Crafty
1
2
3
4
5
>
Report an Issue
Contact*:
Severity*:
High
Normal
Low
Description*:
Screenshot loading...
Cancel
Submit