The difference between the evaporation rate of fresh and salt water makes for a simple and educational science project. If you are a student preparing a science fair project or class presentation or simply looking to further your basic scientific knowledge, conduct this experiment to demonstrate that fresh water evaporates faster than salt water.
Equipment and Materials
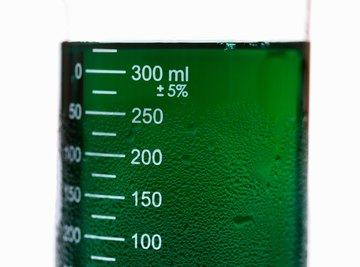
Assemble five identical glass beakers with measuring scales printed on the side, a weighing scale capable of measuring grams, labels and a pen to mark your beakers, a thermometer, a teaspoon, 100 g salt and a source of tap water. Furthermore, you need to find a stable environment where the atmospheric conditions will remain fairly constant, ensuring that your experiment is not exposed to any extremes of temperature or humidity. And if you are preparing a presentation or a project, use a camera to take photographs of every aspect of your experiment.
Experiment Setup
Place the five beakers next to one another on a flat surface so they receive the same light and temperature conditions. Using the scale, weigh out 10, 20, 30 and 40 g of salt, and add each amount to a different beaker. Label the beakers based on the amount of salt inside, leaving one beaker empty as your fresh water control. Add a fixed volume of tap water to each beaker, such as 125 ml, before placing the thermometer next to the five beakers. Note the temperature and time in your experiment log book, and write a small notice to place next to your experiment asking that people do not interfere with the beakers.
Procedure
Return to your beakers once a day for the duration of your experiment, which should last no less than five days. Note down the temperature, time of day and the level of water in each beaker; for consistent results, you are advised to observe your experiment at the same time everyday. Write down any other observations you might observe about the water in the beakers, such as any change of color, consistency or presence of bubbles on the surface. Take photographs of your experiment, including a clear photograph of the water level in each of the beakers.
Results
After at least five days, conclude your experiment. Draw up a line graph with one colored line representing each of the beakers. Mark the x-axis "days" and the y-axis "water volume in ml" and plot a mark on the graph once each day for each beaker based on the water level. If you are preparing a science fair project or presentation, ensure the graphs you produce are large enough that they can be viewed from up to a few feet away as this is the distance viewers will stand when looking at your science fair stall.
References
About the Author
I have been involved in coaching and administration of youth soccer with the Herts FA for several years. I have many years experience with the technical side and equipment of soccer, cricket, rugby, snooker and poker. I studied the health and fitness and dietary side of competitive sport while at University. Currently, I am not ready for on-camera opportunities, but this could change with access to training and equipment.
Photo Credits
Jupiterimages/Photos.com/Getty Images