
Weather maps show different weather indicators to tell about prevailing weather conditions in an area. Weather maps come in different types, telling a different weather story with each one. Some may show the atmospheric pressure, or temperature. Some also show multiple types of data in order to give a well-rounded indication of the weather conditions in a particular area.
Pressure Maps
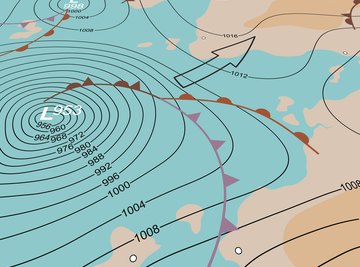
Pressure maps are measured in millibars, and tell the reader where there is high atmospheric pressure, as compared to average sea-level pressure, and where there is low atmospheric pressure. In general, high pressure areas mean that the air is very stable, and usually denotes good weather conditions. Low pressure on the other hand, means that the air is less stable, clouds can form and rain or storms could ensue. According to Weather Questions (see Reference 3) low and high air pressure systems are caused by the heating and cooling of air masses; they vary daily.
Station Model Maps
Station-model maps show the weather conditions at a particular weather station. They report on all kinds of weather conditions, such as temperature, humidity, air pressure, cloud cover or wind speed. Station-model maps are written in meteorological symbols that denote the different weather elements, and larger area maps are made by combining the station-model maps from multiple stations.
Aviation Maps
Aviation maps are live weather maps specifically containing information necessary for the safe flight or aircraft. Information such as wind speed and direction, dew point readings, flight advisory information, temporary flight restrictions, cool and warm weather fronts and icing areas are all displayed on aviation maps. This information is updated in real time so that pilots have an exact map of weather conditions and flight conditions and can safely navigate the skies.
Temperature Maps
Temperature maps show the current temperature in either a color scale or by temperatures in numbers on the map surface. Temperature maps are one of the most common types of weather maps and often combine with cloud cover and precipitation to give a basic weather indication for newspapers and news programs.
Streamline Maps
Streamline maps show the wind patterns in particular areas. Streamline maps use isobaric pressure readings as part of the process but combine and convert the data into much more useful images of actual wind patterns rather than just a pressure reading at different points. According to the Australian Bureau of Meteorology (see Reference 5) a streamline chart is particularly useful in tropical locations, given that the pressure gradients in the tropics are weak and don’t give good indications of wind condition.
References
About the Author
B.T. Alo is media director, chief writer and editor for a U.S.-based marketing and consulting firm. He holds a bachelor's degree in business and communications. Alo's interests include business, investments, electronics, personal finance, health, communication, popular trends and travel.