Shop
Gift Guides
Tech Toys
Tech on a budget
All Shop
Smart Life
Gadgets
Cool Apps
Travel
Smartphones
All Smart Life
Technically for parents
Education
Online Safety
All Technically for parents
Tech Support
How to
Reviews
All Tech Support
Entertainment
What’s streaming
Social Life
All Entertainment
CONNECT WITH US
JOIN OUR NEWSLETTER
Get the latest news and alerts!
Later
Notify
Home
Smart Life
Smart Life
By
Jill Layton
Yuka App Scans Food & Cosmetic Barcodes to Help You Make Informed Choices
Smart Life
By
Jill Layton
Your Inactive Gmail Account Will Soon Be Deleted
Smart Life
By
Jill Layton
Waze Will Now Warn Drivers of Crash-Prone Roads
Smart Life
By
Jill Layton
An Explantation of Grok, Elon Musk's New AI Chatbot
Smart Life
By
Jill Layton
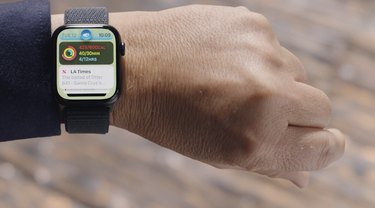
Apple Watch Series 9 Finally Gets the Double Tap Feature
Smart Life
By
Jill Layton
Amazon Will Pay $1 Million for Alien Footage From Ring Devices
Smart Life
By
Jill Layton
Rebel Girls Honors Hispanic Heritage Month With Audio Stories for Kids
Smart Life
By
Jill Layton
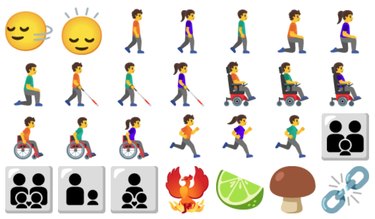
New Emoji Offer Better Representation of People With Disabilities
Smart Life
By
Jill Layton
Lyft Now Lets Women and Nonbinary Riders Request Their Driver's Gender
Smart Life
By
Jill Layton
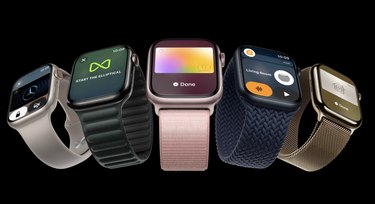
The Apple Watch Ultra 2 Is Now Available for Preorder
Smart Life
By
Jill Layton
Virtual Piano Lessons for Kids That Are Free (and Fun)
Smart Life
By
Jill Layton
This App Provides Early Earthquake Warnings for the West Coast
Smart Life
By
Jill Layton
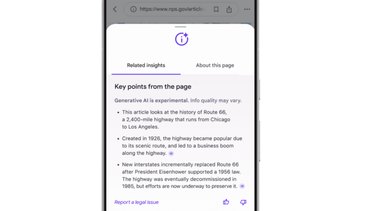
Google Chrome Will Use Generative AI to Summarize Articles
Smart Life
By
Jill Layton
Best Apps for Getting Students Back Into the Swing of Things
Smart Life
By
Jill Layton
Google Search Can Now Check Your Grammar
Smart Life
By
Jill Layton
You Can Now Use ChatGPT on Your Android
Smart Life
By
Jill Layton
A Home Emergency Kit That'll Give You Some Peace of Mind
Smart Life
By
Jill Layton
Spotify and Calm Team up to Offer Free Meditations
Smart Life
By
Jill Layton
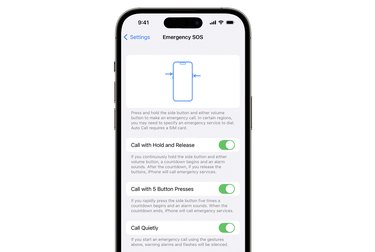
How to Secretly Call 911 on Your iPhone
Smart Life
By
Jill Layton
This App Will Track Your Kids' Summer Reading and Earn Them Prizes
Smart Life
By
Jill Layton
This Harassment Hotline Offers Emotional Support to Online Gamers
Smart Life
By
Jill Layton
Google Lens Now Uses AI to Help Identify Skin Conditions
Smart Life
By
Jill Layton
Google's New AI Shopping Tool Shows How Clothes Fit on All Body Types
Smart Life
By
Jill Layton
How to Mark iPhone Texts as Unread
Smart Life
By
Jill Layton
Apple Will Stop Autocorrecting Your Favorite Swear Word to 'Duck'
Smart Life
By
Jill Layton
Apple Announced a New 15-Inch MacBook Air
Smart Life
By
Jill Layton
You Can Stream Your Shows on This Bowflex Treadmill
Smart Life
By
Jill Layton
Campnab Will Help You Book Sites at Sold out Campgrounds
Smart Life
By
Jill Layton
Uber Is Now Offering Car Seats
Smart Life
By
Jill Layton
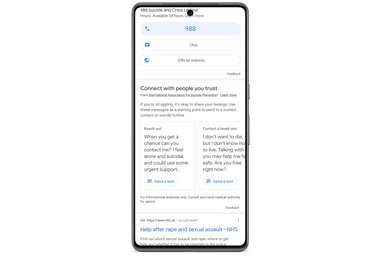
Google Searches Pertaining to Suicide Will Offer Help
Smart Life
By
Jill Layton
5 Podcasts Your Kindergarteners Will Love
Smart Life
By
Jill Layton
The Strangest Items Left in Ubers in 2023
Smart Life
By
Jill Layton
Etsy Now Offers Wedding Registries
Smart Life
By
Jill Layton
An AI Chatbot Will Soon Take Your Wendy's Drive-Through Orders
Smart Life
By
Jill Layton
LinkedIn's AI Will Draft Messages to Send to Hiring Managers for You
Smart Life
By
Jill Layton
Gmail Is Adding Blue Checkmarks
Smart Life
1
2
3
4
5
>
Report an Issue
Contact*:
Severity*:
High
Normal
Low
Description*:
Screenshot loading...
Cancel
Submit