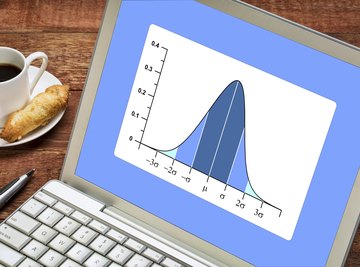

After taking a survey or gathering numerical data on a population, the results need to be analyzed to help you draw conclusions. You want to know parameters such as the average response, how varied the responses were and how the responses are distributed. A normal distribution means that, when plotted, the data create a bell curve that is centered on the average response and tails off equally in both positive and negative directions. If the data is not centered on the average and one tail is longer than the other, then the distribution of data is skewed. You can calculate the amount of skew in the data using the average, the standard deviation and the number of data points.
Calculate Population Skewness
Add together all values in the data set and divide by the number of data points to get the average, or mean. For this example, we will assume a data set that includes responses from an entire population: 2, 4, 5, 7, 8, 10, 11, 25, 26, 27, 36. This set has a mean of 14.6.
Calculate the standard deviation of the data set by squaring the difference between each data point and the mean, adding together all of those results, then dividing by the number of data points, and finally taking the square root. Our data set has a standard deviation of 11.1.
Find the difference between each data point and the mean, divide by the standard deviation, cube that number, and then add all of those numbers together for each data point. This equals 6.79.
Calculate the population skewness by dividing 6.79 by the total number of data points. The population skewness for this example is 0.617.
Calculate Sample Skewness
- Data set
- Calculator
Positive values of skewness mean that the most common response, or mode, is to the left of the mean, and the longest tail of the resulting bell curve is on the right-hand side. Negative values of skewness mean the mode is to the right of the mean, and the longest tail of the bell curve is on the left-hand side.
Because of the repeated sums and differences in these equations, spreadsheet programs are valuable tools for calculating skew.
Calculate the mean and standard deviation from a data set that is only a sample of the entire population. We will use the same data set as the previous example with mean 14.6 and standard deviation 11.1, assuming that these numbers are only a sample of a larger population.
Find the difference between each data point and the mean, cube that number, add together each result, and then divide by the cube of the standard deviation. This equals 5.89.
Calculate sample skewness by multiplying 5.89 by the number of data points, divided by the number of data points minus 1, and divided again by the number of data points minus 2. Sample skewness for this example would be 0.720.
Things You'll Need
Tips
References
Tips
- Positive values of skewness mean that the most common response, or mode, is to the left of the mean, and the longest tail of the resulting bell curve is on the right-hand side. Negative values of skewness mean the mode is to the right of the mean, and the longest tail of the bell curve is on the left-hand side.
- Because of the repeated sums and differences in these equations, spreadsheet programs are valuable tools for calculating skew.
About the Author
Joshua Bush has been writing from Charlottesville, Va., since 2006, specializing in science and culture. He has authored several articles in peer-reviewed science journals in the field of tissue engineering. Bush holds a Ph.D. in chemical engineering from Texas A&M University.
Photo Credits
marekuliasz/iStock/Getty Images