Stock charts are graphs that show you how a stock behaves over a period of time. For example, stock charts can help you track a stock's up or down movement and may indicate the best time to buy or sell a stock. Stock charts help you figure out your next investment or assess your current investment strategy. In the United States, the basic stock chart shows the price in U.S. dollars on the vertical axis and time in months on the horizontal axis.
Step 1
Locate the stock symbol at the top of stock chart. The chart will also contain information about the stock's highs and lows (depicted by vertical bars), the volume traded (shown by a bar graph at the bottom of the chart), and the closing price in plain English.
Video of the Day
Step 2
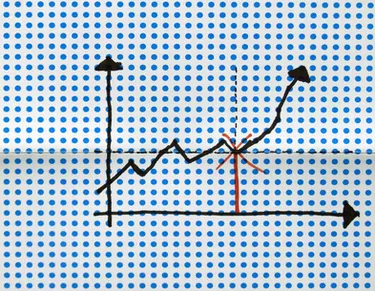
Find the trend direction by looking at a 20-day and 50-day moving average (MA). Moving averages are generally located below the stock symbol on a chart. For example, an MA might be (20) 45.30. That means the moving 20-day average is 45.30 for the last 20 days. A general rule of thumb is that if the 20-day MA is above the 50-day, then the stock is trending up; if the 20-day MA is below the 50-day, the stock is trending down. You can also spot an upward trend by noticing a graph tending toward the top right corner of the graph; a downward trending stock will start creeping toward the bottom right.
Step 3
Identify the price support. A price support is a low point in trading that the stock never falls below. On a graph, the stock might go up and down haphazardly; you want to find the point on the graph that's the lowest.
Step 4
Identify the price resistance. In general, price resistance is the point on the graph where the price "tops out." In other words, the maximum value on the graph. Price resistance is the opposite of price support.
Step 5
Repeat the above steps for as many stocks as possible over a few weeks. You'll begin to notice trends, and will be more able to identify price support and resistance over a period of time. You'll also be able to see when the price resistance breaks through; when this happens, it can make for a flurry of trading, as it usually means something exciting has been announced in that particular company.
Tip
Concentrate on year-to-date and three-month charts, rather than long-term charts, if you are interested in investing. Long-term (three- and five-year charts) won't provide you with good investment choices.
Video of the Day