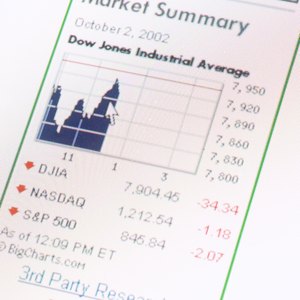


A share price index tells you how well a particular segment of stocks is doing. Well-known indices include the Dow Jones Industrial Average, the S&P 500, and the Wilshire 5000. There are actually indices for almost every sector of the economy. You can track a share's index by using the most current stock prices and market divisors. Indices are also published online and in newspapers.
Market Cap Weighted Index
Find the market capitalization of each stock in the index by multiplying the price of the stock by the overall number of shares. For example, if a share is $5 and there are 500,000 of them, then 5 x 500,000 = $2.5 million market cap.
Add the market caps together.
Look up the official industrial averages divisor number, which is published daily in "The Wall Street Journal."
Divide the sum of the market caps by the divisor. The answer is the share index average.
Price Weighted Index Calculation
Look up the most current prices of the stock and write them down.
Add the stock prices together.
Divide the sum by the current Dow Jones divisor. The total is your index average.
References
- Ask Dave Taylor: How is a Stock Index Calculated?
- The Options Guide: Capitalization-Weighted Index
- S&P Dow Jones Indices. "Dow Jones Averages Methodology," Pages 3 & 5. Downloaded from "Dow Jones Industrial Average®," Select "Methodology." Accessed May 30, 2020.
- Zacks. "Stock Market Points Vs. Percent." Accessed May 30, 2020.
- S&P Dow Jones Indices. "Dow Jones Averages Methodology," Page 3. Downloaded from "Dow Jones Industrial Average®," Select "Methodology." Accessed May 30, 2020.
- S&P Dow Jones Indices. "Dow Jones Averages Methodology," Page 11. Downloaded from "Dow Jones Industrial Average®," Select "Methodology." Accessed May 30, 2020.
- The Library of Congress. "Dow Jones Industrial Average First Published." Accessed May 30, 2020.
- Valeriy Zakamulin. "Market Timing with Moving Averages: The Anatomy and Performance of Trading Rules," Page 224. Springer, 2017.
- Geoffrey Poitras. "Valuation of Equity Securities: History, Theory and Application," Page 161. World Scientific, 2010.
- Independent Stock Review "History of the Dow Jones Industrials Index 1884 - 2002." Accessed May 30, 2020.
- Bloomberg. "NDU:IND," Accessed May 30, 2020.
- S&P Dow Jones Indices. "The Evolution of the Dow." Accessed May 30, 2020.
- Cision PR Newswire. "Walgreens Boots Alliance Set to Join Dow Jones Industrial Average." Accessed May 30, 2020.
- Zacks. "How Many Stocks Are in Dow Jones Industrial Average?" Accessed My 30, 2020.
- Morningstar. "Calculating the Dow." Accessed May 30, 2020.
- Global Financial Data. "The Complete Dow Jones Industrial Average." Accessed May 30, 2020.
- S&P Dow Jones Indices. "Dow Jones Averages Methodology," Page 7. Downloaded from "Dow Jones Industrial Average®," Select "Methodology." Accessed May 30, 2020.
- Wilshire. "Wilshire 5000 Family : Wilshire 5000 Total Market Index." Accessed May 30, 2020.
- S&P Dow Jones Indices. "S&P U.S. Indices Methodology," Page 3. Accessed May 30, 2020.
- CNBC. "An indicator with a nearly perfect track record is predicting a stock market pullback." Accessed May 30, 2020.
Writer Bio
Susan Reynolds has been a writer since 2008. She holds a B.A. in English from the University of South Florida and is a licensed real estate agent in Florida.