Sciencing_Icons_Science
SCIENCE
Sciencing_Icons_Biology
Biology
Sciencing_Icons_Cells
Cells
Sciencing_Icons_Molecular
Molecular
Sciencing_Icons_Microorganisms
Microorganisms
Sciencing_Icons_Genetics
Genetics
Sciencing_Icons_Human Body
Human Body
Sciencing_Icons_Ecology
Ecology
Sciencing_Icons_Chemistry
Chemistry
Sciencing_Icons_Atomic & Molecular Structure
Atomic & Molecular Structure
Sciencing_Icons_Bonds
Bonds
Sciencing_Icons_Reactions
Reactions
Sciencing_Icons_Stoichiometry
Stoichiometry
Sciencing_Icons_Solutions
Solutions
Sciencing_Icons_Acids & Bases
Acids & Bases
Sciencing_Icons_Thermodynamics
Thermodynamics
Sciencing_Icons_Organic Chemistry
Organic Chemistry
Sciencing_Icons_Physics
Physics
Sciencing_Icons_Fundamentals-Physics
Fundamentals
Mechanics
Sciencing_Icons_Electronics
Electronics
Sciencing_Icons_Waves
Waves
Sciencing_Icons_Energy
Energy
Sciencing_Icons_Fluid
Fluid
Sciencing_Icons_Astronomy
Astronomy
Sciencing_Icons_Geology
Geology
Sciencing_Icons_Fundamentals-Geology
Fundamentals
Sciencing_Icons_Minerals & Rocks
Minerals & Rocks
Sciencing_Icons_Earth Scructure
Earth Structure
Sciencing_Icons_Fossils
Fossils
Sciencing_Icons_Natural Disasters
Natural Disasters
Sciencing_Icons_Nature
Nature
Sciencing_Icons_Ecosystems
Ecosystems
Sciencing_Icons_Environment
Environment
Sciencing_Icons_Insects
Insects
Sciencing_Icons_Plants & Mushrooms
Plants & Mushrooms
Sciencing_Icons_Animals
Animals
Sciencing_Icons_Math
MATH
Sciencing_Icons_Arithmetic
Arithmetic
Sciencing_Icons_Addition & Subtraction
Addition & Subtraction
Sciencing_Icons_Multiplication & Division
Multiplication & Division
Sciencing_Icons_Decimals
Decimals
Sciencing_Icons_Fractions
Fractions
Sciencing_Icons_Conversions
Conversions
Sciencing_Icons_Algebra
Algebra
Sciencing_Icons_Working with Units
Working With Units
Sciencing_Icons_Equations & Expressions
Equations & Expressions
Sciencing_Icons_Ratios & Proportions
Ratios & Proportions
Sciencing_Icons_Inequalities
Inequalities
Sciencing_Icons_Exponents & Logarithms
Exponents & Logarithms
Sciencing_Icons_Factorization
Factorization
Sciencing_Icons_Functions
Functions
Sciencing_Icons_Linear Equations
Linear Equations
Sciencing_Icons_Graphs
Graphs
Sciencing_Icons_Quadratics
Quadratics
Sciencing_Icons_Polynomials
Polynomials
Sciencing_Icons_Geometry
Geometry
Sciencing_Icons_Fundamentals-Geometry
Fundamentals
Sciencing_Icons_Cartesian
Cartesian
Sciencing_Icons_Circles
Circles
Sciencing_Icons_Solids
Solids
Sciencing_Icons_Trigonometry
Trigonometry
Sciencing_Icons_Probability-Statistics
Probability & Statistics
Sciencing_Icons_Mean-Median-Mode
Mean/Median/Mode
Sciencing_Icons_Independent-Dependent Variables
Independent/Dependent Variables
Sciencing_Icons_Deviation
Deviation
Sciencing_Icons_Correlation
Correlation
Sciencing_Icons_Sampling
Sampling
Sciencing_Icons_Distributions
Distributions
Sciencing_Icons_Probability
Probability
Sciencing_Icons_Calculus
Calculus
Sciencing_Icons_Differentiation-Integration
Differentiation/Integration
Sciencing_Icons_Application
Application
Sciencing_Icons_Projects
PROJECTS
Sciencing_Icons_Biology
Biology
Sciencing_Icons_Chemistry
Chemistry
Sciencing_Icons_Physics
Physics
Sciencing_Icons_Geology
Geology
Sciencing_Icons_Nature
Nature
Sciencing_Icons_Arithmetic
Arithmetic
Sciencing_Icons_Algebra
Algebra
Sciencing_Icons_Geometry
Geometry
Sciencing_Icons_Probability-Statistics
Probability & Statistics
Sciencing_Icons_Calculus
Calculus
Sciencing_Icons_News
NEWS
Share
Tweet
Email
Print
Physics
Science
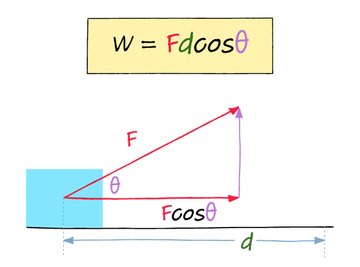
Work (Physics): Definition, Formula, How to Calculate (w/ Diagram & Examples)
Sciencing
What is Inertia?
Sciencing
What is Chemical Energy?
Science
What Do Stars Look Like?
Science
What Are Coterminal Angles?
Science
What is Planck's Constant?
Science
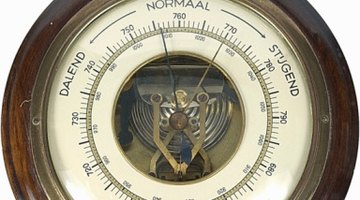
How to Understand Barometric Pressure Readings
Science
Types of Nuclear Energy
Science
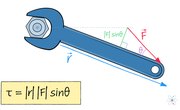
Torque: Definition, Equation, Units (w/ Diagram & Examples)
Sciencing
Three Major Characteristics of the Inner Planets
Sciencing
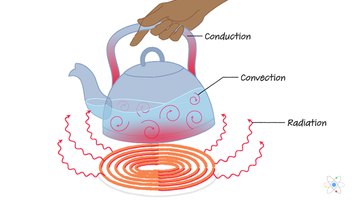
Thermal Energy: Definition, Equation, Types (w/ Diagram & Examples)
Sciencing
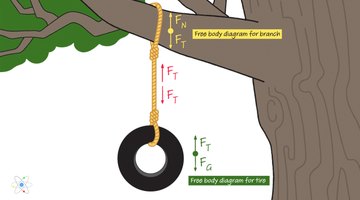
Tension (Physics): Definition, Formula, How to Find (w/ Diagrams & Examples)
Sciencing
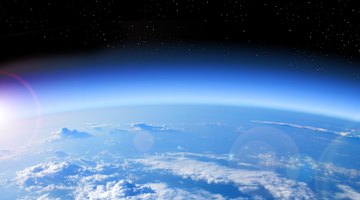
The Temperatures of Outer Space Around the Earth
Sciencing
Are the Sun & Moon Planets?
Sciencing
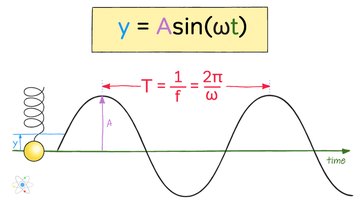
Simple Harmonic Motion: Definition & Equations (w/ Diagrams & Examples)
Sciencing
How Does a Pulley System Work?
Sciencing
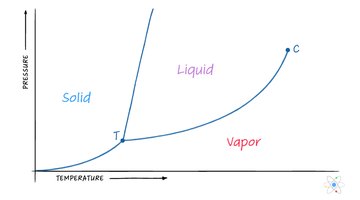
Phase Transitions: Types, Classifications, Properties & Examples (w/ Diagram)
Sciencing
What Is a Pascal Unit?