

A dendrogram is a graphical representation of hierarchical clusters, which are usually generated through a mathematical process, such as cluster analysis. The purpose of a dendrogram is to display the relationships among distinct units by grouping them into smaller and smaller clusters, as shown in the steps below. Dendrograms are typically created by computer programs such as Microsoft Excel, but anyone can create one from a list of related items.
Write down all of the units that will be in the dendrogram. As an example, consider this list: apple, beagle, spinach, lizard, Siamese, cherry, kale, poodle, carrot, snake, and robin.
Determine how to cluster the units. The clustering method used will depend on the units being grouped together. The objective is to put like units into small groups and then similar small groups into larger groups, until the whole list is in a single cluster. Name each group. In our example, the entire list could be called "living things," while the beagle and poodle could be in a group called "dogs."
Write the list of units across the bottom of a piece of paper. Order them so that the smallest groups are near each other.
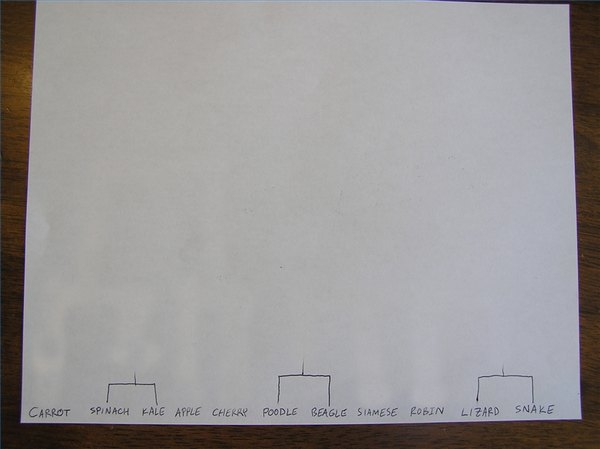
Draw lines to connect those units that are placed into groups of only two. Not every unit will fall into such a group.

Draw lines to connect groups of three or four. This may involve connecting groups of two from Step 4.
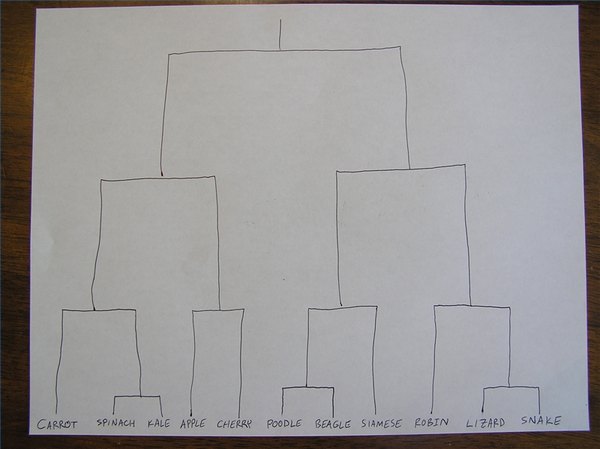
Continue connecting larger and larger groups until all units are connected. This completed chart is a dendrogram.
About the Author
This article was written by the CareerTrend team, copy edited and fact checked through a multi-point auditing system, in efforts to ensure our readers only receive the best information. To submit your questions or ideas, or to simply learn more about CareerTrend, contact us [here](http://careertrend.com/about-us).