Custom animation in PowerPoint 2007 is used to animate pictures, graphics and charts. Many presenters like to add animation to make their presentations more dynamic. There are four types of animations that can be applied: an entrance effect, emphasis effect, an exit effect, and a motion path effect. Each of these effects have numerous animation styles available to choose from.
Entrance Effect
Video of the Day
The entrance effect tells PowerPoint how the item will appear in the presentation. By default, all images, graphs and other graphic items simply appear in the slide. However, by applying an entrance effect, the user can control not only how the item appears, but also when. This allows the presenter to display graphical items before, during or after discussing the slide.
Video of the Day
Emphasis Effect
Sometimes presenters like to have an image change once it is in the slide. These changes can include having the object grow, shrink, fade, change colors, change fonts, become transparent or blink. This gives the benefit of emphasizing a point while speaking, and also adds some pizzazz to the presentation. For example, you can use the emphasis effect as you talk about each bar in a bar chart.
Exit Effect
The exit effect is essentially how an animation leaves the screen. Presenters often use exit effects in conjunction with entrance effects to have an item disappear in tandem as another object is appearing. Some exit effects can be subtle, like simply disappearing, while other effects can be more exciting, like spiraling out or bouncing off the screen.
Motion Path Effect
The motion path effect allows a presenter to create movement in a presentation. Motion paths are used to move images across the screen. Some examples include moving text boxes to the middle of the screen while speaking and then move them back to the original position, separating pieces of a pie chart, or even having a picture zoom across the screen. There are more than 65 different motion paths available to choose from or a presenter can create a custom motion path.
How to Apply a Custom Animation
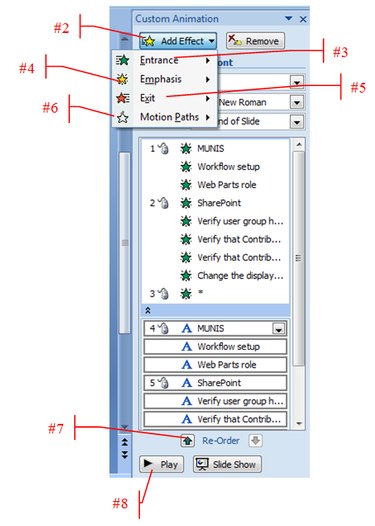
- On the "Animations" tab, click the "Custom Animation" button.
- Click the "Add Effect" button.
- To make the text or object enter the slide show presentation with an effect, select an "Entrance Effect."
- To add an effect to text or an object that is on the slide, select an "Emphasis Effect."
- To add an effect to text or an object that makes it leave the slide at some point, select an "Exit Effect."
- To add an effect that makes an object move in a specified pattern, select a "Motion Path Effect."
- To reorder the animations, click the "Reorder" buttons.
- To preview the animation, click the "Play" button.