Genograms and ecomaps are two visual ways to represent relationships and information about a person. While they share some traits, these two diagrams feature lots of different information and serve somewhat different purposes. Both can be useful, but understanding the differences between genograms and ecomaps can help you decide which is most beneficial for you.
Genogram Basics
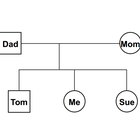
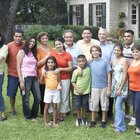
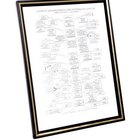
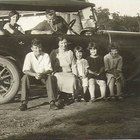
A genogram is a type of family tree with additional details to provide more information about your family history. People in your family appear in a hierarchy with the oldest generation at the top and subsequent generations spanning out below. Lines connecting the people in your family show various relationships.
Genograms use a distinct set of symbols to help define relationships. People displayed with a square are males. Circles represent the females in the family. An X through someone's symbol indicates that the person passed away.
The relatives in a genogram are arranged with parents side by side and their kids below them. Horizontal lines connect the parents, and a vertical line leads down to their kids. The kids show up from oldest to youngest with the oldest on the left. Different types of lines can connect people to give additional details about their relationship. Lines can indicate marriages, divorces, engagements, affairs, friendship, love, hostility, abuse and other types of relationships.
Genograms often include health information about family members. A color corresponding to the health condition appears in the person's gender shape. For example, if your brother has autism, his square symbol will have blue in it.
Ecomap Basics
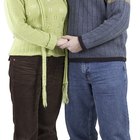
An ecomap typically focuses on one person and details that person's social and personal relationships, taking the person's environment into account. It's less about documenting family history and more about dissecting the person's relationships and both positive and negative factors in his life.
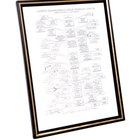
The person who is the focus of the ecomap goes inside a large circle at the center of the chart. Smaller circles around the middle circle represent different relationships, groups, institutions and other relevant factors in the person's life. Information often put on an ecomap includes:
- Extended family
- Sources of income and financial status
- Friends
- Medical and health care information
- Work
- School
- Neighborhood details
- Religious affiliations
- Social services received
- Recreation, interests and hobbies
Lines connect those smaller circles to the center circle. The type of line provides information about the connection. For example, a double line shows there is a strong, positive connection between the two. A dashed line shows the relationship is distant. A zigzag line can indicate a stressful connection. Line thickness can also be used to show the intensity of the relationship.
Arrows at the ends of the lines show which way the influence goes. If a relationship is mutually positive and strong, the line has arrows on both ends. If the influence flows only one way, the arrow is on one end. For example, if the person receives a service like health care or social security, the arrow would point only to the person in the middle.
Similarities Between Genograms and Ecomaps
The presentation and specific details on genograms and ecomaps may be slightly different, but the two charts do overlap in some areas. Both provide detailed information about relationships. A genogram may be used as a starting point for an ecomap. The genogram provides the basic family relationships to include on the ecomap along with details on the state of those relationships. Both genograms and ecomaps may need to be updated regularly since relationships often change.
Uses for Genograms and Ecomaps
Both types of charts have practical applications, but the situation in which they are used may differ. Genograms can be used for general family history documentation. You can gain knowledge on your family history that can shed light on your situation and relationships. Genograms are also useful from a health care perspective if they have enough detail. Your health care provider can use the information to learn about the medical conditions that run in your family. This can influence your care and what you do to prevent those diseases.
Ecomaps are often used by a social worker to identify areas of need for a client. The social worker may create the ecomap based on information gathered from the client. Ecomaps can help evaluate family dynamics and help solve problems facing the client. The chart can help identify potential resources and support.
Related Articles

What Are the Genogram Symbols?
How to Draw Genograms
How to Find Twins on Pedigree Charts

How to Make a Genogram Chart
How to Do a Genogram
Family Tree Rules
How to Construct a Kinship Diagram
INFJ & ISFJ Relationships

How to Draw a Family Tree When There Is ...
How to Make a Free Genogram
How to Make a Men's Kimono

The Effects of Lack of Communication in ...
How to Give a Written Analysis of a ...
4 Elements of Design
How to Find People You've Lost Touch ...
How to Create a Family Shield

What Is Fraternal Love?
How to Find Out Where Your Family Came ...
How to Trace Haitian Ancestry
How to Design a Headstone
References
Writer Bio
Shelley Frost writes professionally on a full-time basis, specializing in lifestyle, family, parenting and relationship topics. She holds an education degree and has extensive experience working with kids and parents.
Photo Credits
Jupiterimages/liquidlibrary/Getty Images