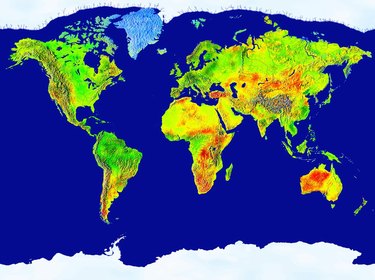
A climate map is a depiction of prevailing weather patterns in a given area. It usually consists of a conventional map overlaid with colors representing climate zones. The map's legend helps you identify each zone.
What Is Climate?
Video of the Day
The term "climate" refers to dominant and recurring weather patterns over a long period of time. The information presented in most climate maps has been compiled from readings taken for decades.
Video of the Day
What Do Climate Maps Map?
Climate maps can represent the climates of a region, continent or the entire world. They use a combination of precipitation, temperature, seasonal variations and geographic features to identify climate zones.
What is a Climate Zone?
The Koeppen-Geiger climate classification system identifies 31 climate zones based on five main climate types: equatorial, arid, warm-temperature, snow and polar. In addition to color, a Koeppen-Geiger map uses a letter code to specify differences among zones.
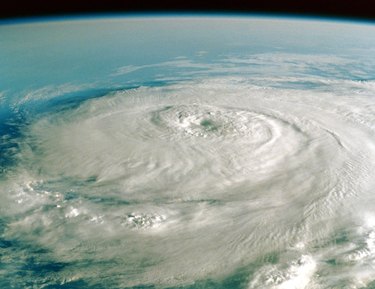
Global Warming
Climate maps help scientists track, measure and illustrate climate change. On Oct. 22, 2009, the British government released a climate map based on computer models depicting the possible effects of global warming by 2060.
Interactive Climate Maps
Interactive climate maps are now available on the web. They enable you to find specific climate information about cities and towns in the United States and around the world.