The difference between a data flow diagram (DFD) and a flow chart (FC) are that a data flow diagram typically describes the data flow within a system and the flow chart usually describes the detailed logic of a business process.
Understanding a Data Flow Diagram
Video of the Day
Data flow diagrams are welcomed tools used in structured analysis and design methods, showing the flow of information through a system. Each process transforms input into outputs. Begin analyzing by diagramming an overall view of the system, typically by drawing a context diagram. Then methodically detail each process in a diagrammed top-down approach, starting with the level one identifying the major system process and proceeding to level two in order to further analyze the process. The data flow diagram results are a series of diagrams representing the system activity in a clear and concise manner.
Video of the Day
Using a Data Flow Diagram
When using a data flow diagram to illustrate the processes of a system, it is necessary to use five symbols. The external entity, an oval, represents a source or destination of a data flow outside the area of study. The process, a rectangular box, represents the manipulation of data flows within the system. A line represents the data flow with arrows showing the direction flow, typically from its source to its destination. A data store is a storage bin for information within the system, represented by an open-ended narrow rectangle. A resource flow shows the flow of any physical material from its source to its destination.
Understanding a Flow Chart
Flow charts are easy-to-understand diagrams, which visually illustrate how each process works by being broken down into steps. A flow chart is an excellent communication tool and helps to clarify or question the purpose of the procedure and if there is a need for improvement.
Using a Flow Chart
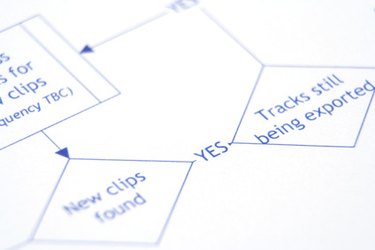
Using a flow chart typically requires the use of three types of symbols: an elongated circle representing the start and the end of a process; a rectangle signifying instructions or actions; and a diamond indicating that a decision is necessary. As you work through the whole procedure that you are charting, indicate each process with a symbol and show the connection to the next process and the flow of each process with an arrow. Sometimes it is necessary to continue your flow chart on more than one piece of paper; if this occurs, use connectors by using numbers inside of circles. It is imperative that you remember that the flow chart is a means of communicating.
In Contrast
While data flow diagrams represent the flow of data, a flow chart shows the flow of control. In a flow chart, a reader can determine what operations will be performed, in what order, and under what circumstances. In a data flow diagram, identifying the procedural information is not necessary. It also not necessary to show information regarding the timing of processes, or whether the process will operate in a sequence or in a parallel, in the data flow diagram, but it is crucial in a flow chart.